
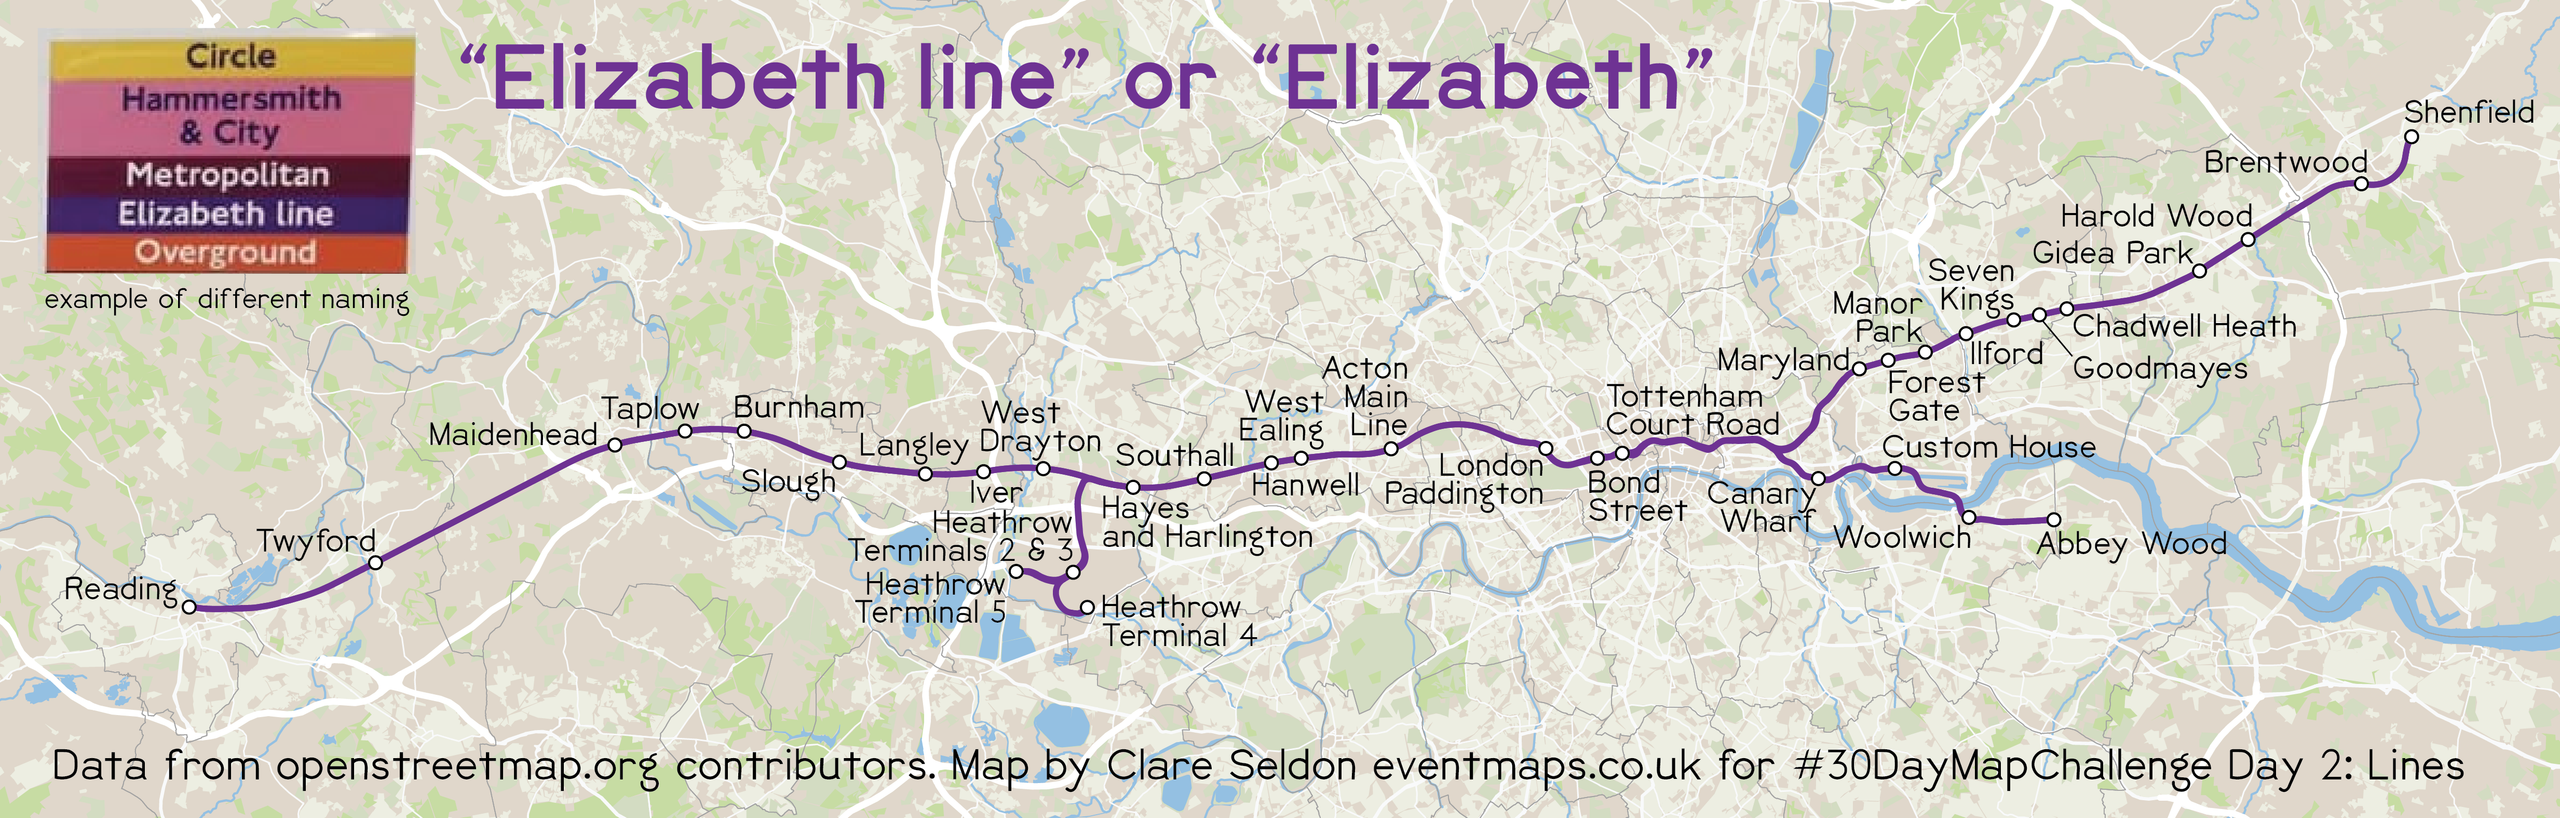
Here is my map collection that I made for the 2026 challenge.
Table of Contents
Directly from the 30DMC website: “The 2026 challenge runs from 1 to 30 November… Here are the 30 daily themes. As always, you’re free to use any tools and data you like.”
Introduction
Day 1. Points
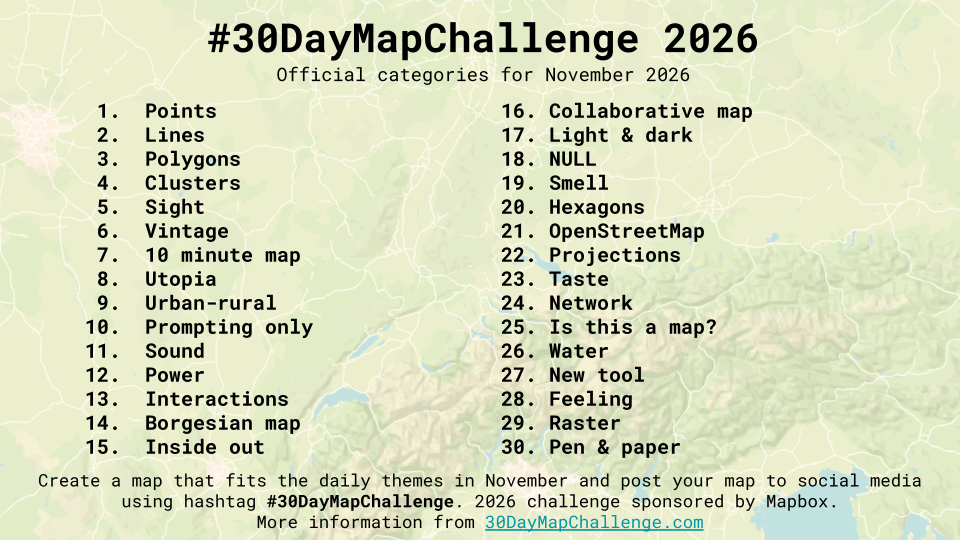
What is the point of cartography?
I believe cartography and mapping are important to make a difference in our world. I try to make complex ideas simpler for everyone to understand in all my work, and my LinkedIn reviews validate that. So, “Thank you” to those shown on the map, and to all those who have supported me as a freelance cartographer for the last 2 years!
Please see LinkedIn for my full reviews.
Day 2. Lines
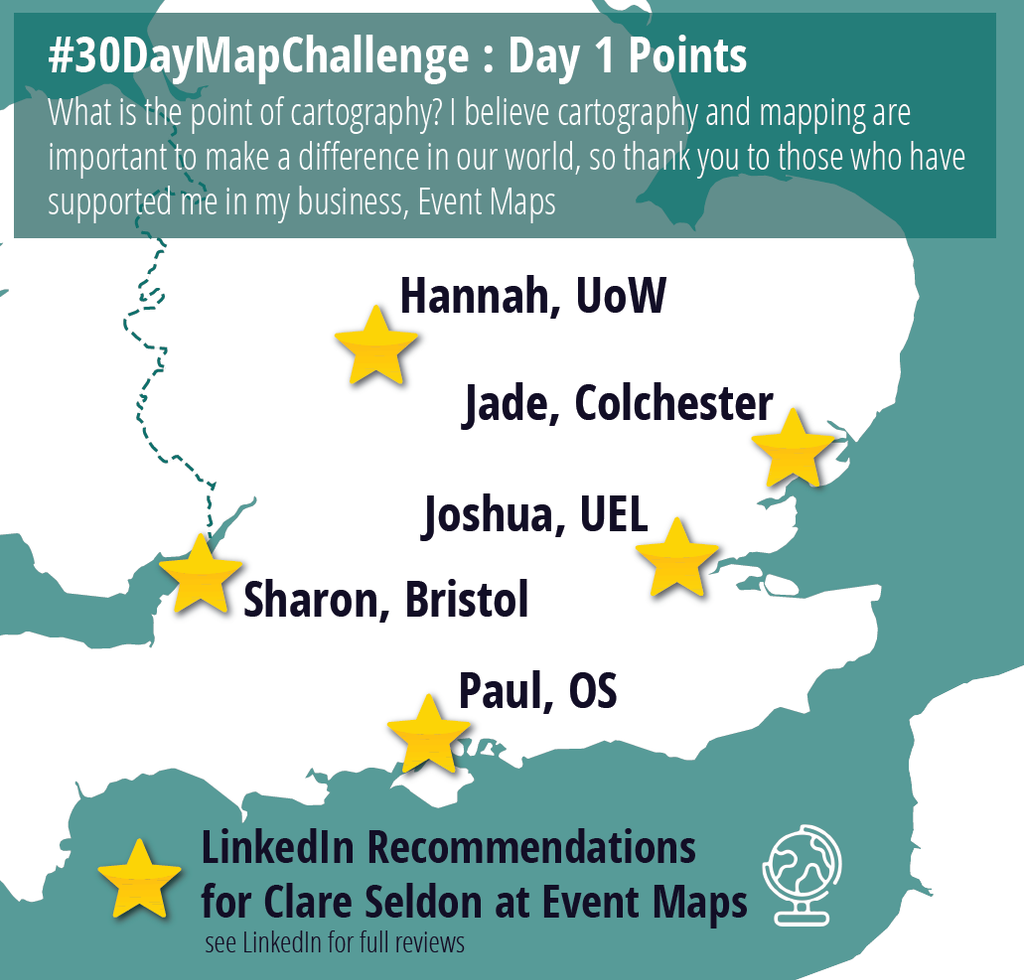
It always looks odd to me as to why the Elizabeth line has the extra word “line” to it’s signage and the other lines do not. Especially if you prioritise from a user’s point of view – why is it needed? So I investigated…
It turns out that because it’s a different MODE than the tube lines, it uses a different convention. Some blame Boris for changing the formal name from “Crossrail” to “Elizabeth line”, but if he’d kept Crossrail as the mode and used Elizabeth as the branch or service name, we could have dropped the “line” part on the signage. If Crossrail 2 ever comes about, it’ll be a headache to call it “Elizabeth line: George” or whatever!
Anyway, there is hope, as there is precedent for similar larger train stock lines such as the Metropolitan Railway to eventually lose the second part of the name, so let’s hope for a simpler “Elizabeth”, like “Victoria”, and help make it easier for users and designers of the future!
If you want to see a time-lapse of most of this map being made, see my Instagram pages Instagram reels @eventmapsclare
Day 3. Polygons
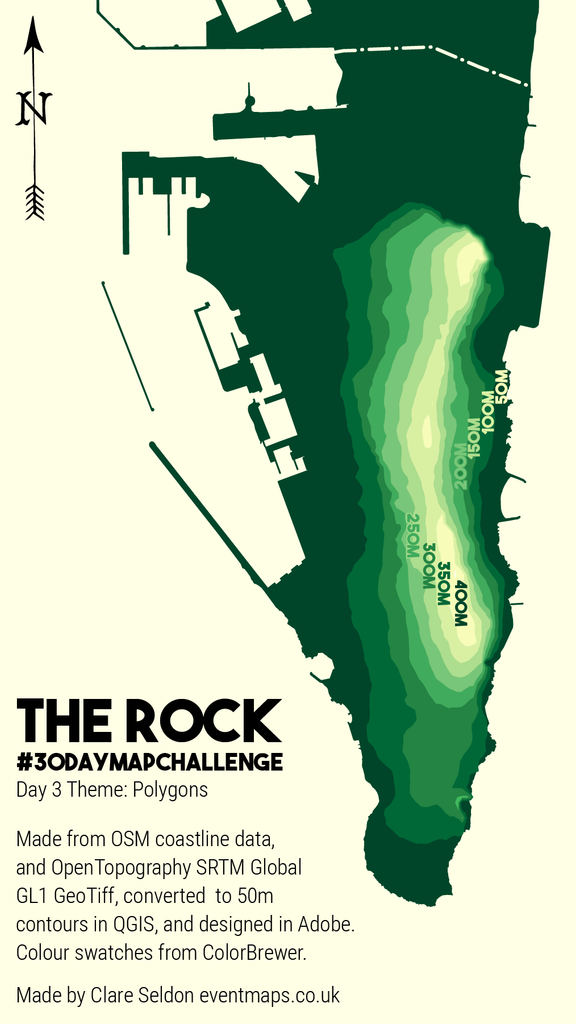
The topography of mountains is lost on many maps, as we view them in 2D from above. I’ve been mapping this area for a project and am amazed at the photographs I see of The Rock of Gibraltar, standing at 426m high, as the flat base data doesn’t do it justice.
So I have extracted the contour polygons from the SRTM data to create this celebration of “The Rock”.
Day 4. Clusters
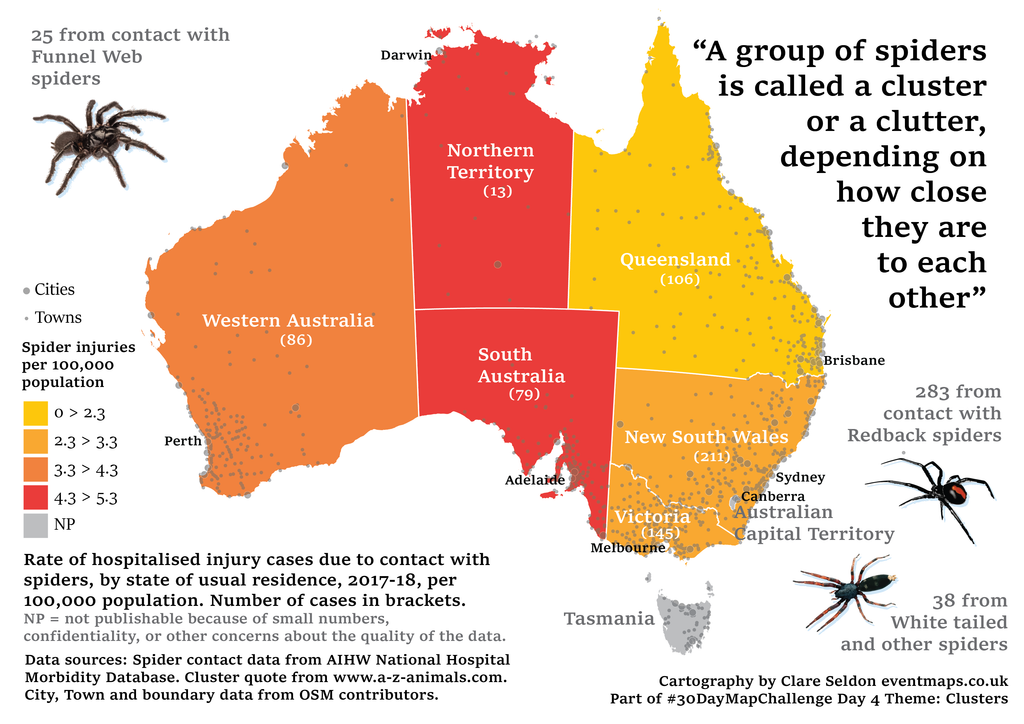
Did you know that a group of spiders is called a cluster or a clutter?
I braved my fear and researched some images and data!
I found some great population-rationalised data from the Australian Institute of Health and Welfare (AIHW) to add to a base map, including table breakdowns of types and actual numbers reported. It’s important to remember the extreme remoteness and spread of population in Australia when looking at state-wide data, so I added the main city and town points for context.
I also hope you appreciate the slightly spooky/halloween/pumpkin style to the map – even if we’re already well into the Christmas adverts on TV!
Day 5. Sight
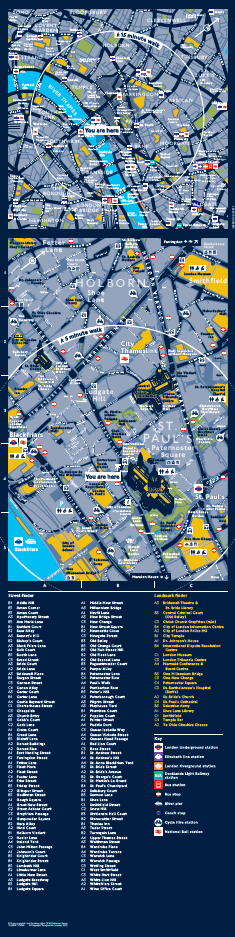
Sight is an essential factor in City Wayfinding, especially useful in making our brains link from a flat map to the real world and making real world landmarks stand out on the map to orientate yourself.
Here’s some maps from T-Kartor that use key landmarks as visual aids to find your way, like visual breadcrumbs from A to B to C, important when the user can’t take the map with them!
See this video from T-Kartor for more about heads-up wayfinding in our busiest cities.
Day 6. Vintage
After searching OpenStreetMap for “Vintage” to see if there was a town called Vintage, I was disappointed that there were only very small neighbourhoods or hamlets.
So, I searched for “Vintage Map”… nothing
I tried “Vintage Globe”… and bingo!
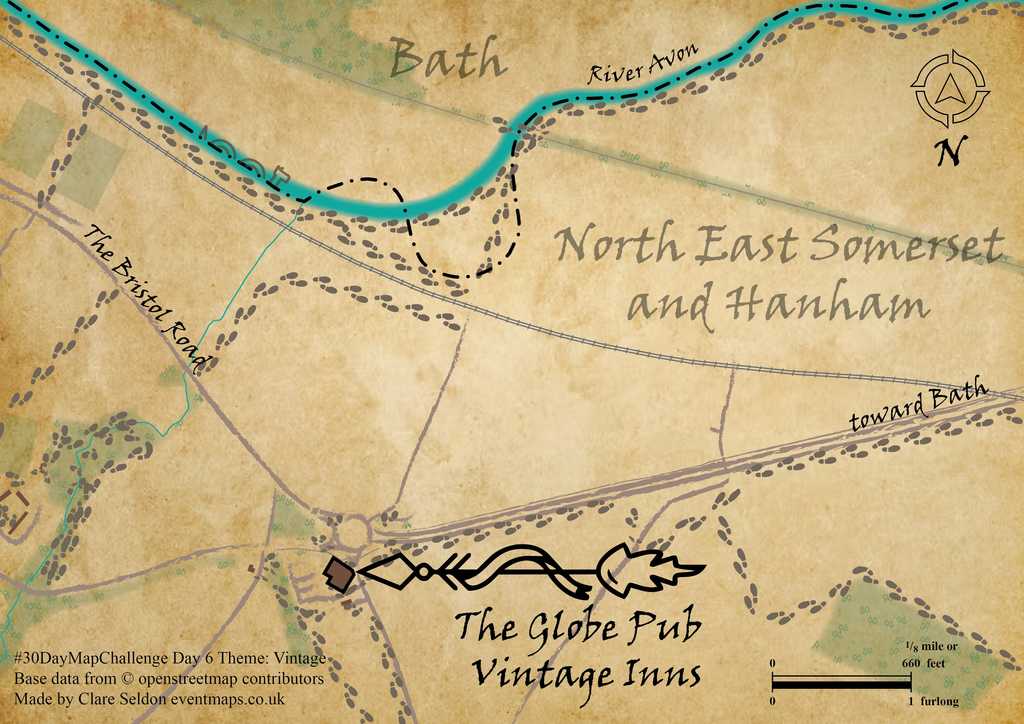
So, this is a map of The Globe Public House, part of the Vintage Inns chain. Fortunately for my map, it’s in a fairly pretty part of the world, west of Bath, just south of the River Avon.
To create my map, I used many feather effects for the areas, and the “charcoal – feather” brush that has been a staple in the brushes palette for many years and now I’ve finally been able to use it. I came across the VINer Hand ITC font because I started to search for VINtage… lucky… and I used furlong and feet in the scale because I guess meters are a bit modern. I added some footprints to the footways to make it a bit treasure-hunt-like in style…
Thanks to my Noun Project subscription for the “fancy arrow” and Compass Rose, as well as a hidden little friend…
Day 7. 10-minute map
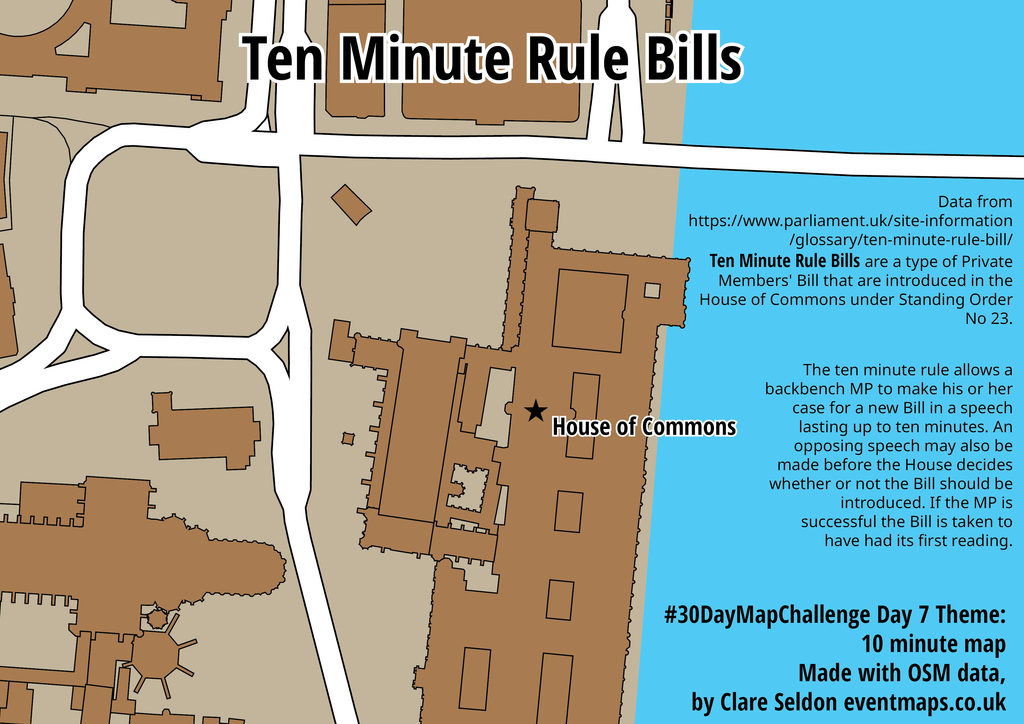
I googled “10 minutes” and one of the first things to come up, after the online countdown apps, was the UK Parliament’s Ten Minute Rule Bill. So I set up a timer and recorded my 10-minute mapping effort!
💻 First, I used the QuickOSM plugin in QGIS to download the urban buildings and roads.
🌍 Then, I saved the data and loaded it into Adobe Illustrator using MAPublisher, where I could change the projection from WGS84 to British National Grid and rescale to my page size.
✍ I then created a road style and visually joined all the primary roads to look like one network. I then coloured the building shapes and base colour. I tried to download the river outline but kept getting centreline data for the river from OSM, so I gave up and drew a polygon in Illustrator, as it was pretty simple and I was running out of time to check the correct OSM tag that I needed.
⭐ I then added a symbol for the Houses of Parliament and the text and data source.
What I learnt:
💡10 minutes is actually a pretty short time to make a map!! (and my write-up and reel editing are probably taking just as long…)
💡I wanted longer to get the colours nicer
💡Smiling at the camera cost me a valuable 5 seconds!!
🎥 Watch me create the map in Instagram Reels
Day 8. Utopia
I had to think hard about this and what subject I might like to dream up… I thought about how Oxford Street might look next year, once pedestrians are truly allowed to take over, or what I’d like my city to look like for my children’s future.
Then I attended a Remembrance Day Parade with my children this morning, and the first sermon reflected on a news article I’d seen this week about Winston Churchill’s 12-year-old great-great-grandson interviewing two World War II veterans. When asked what they would want to pass on to the next generation, they both said, “Peace, Everywhere”.
I can’t think of a better Utopia.
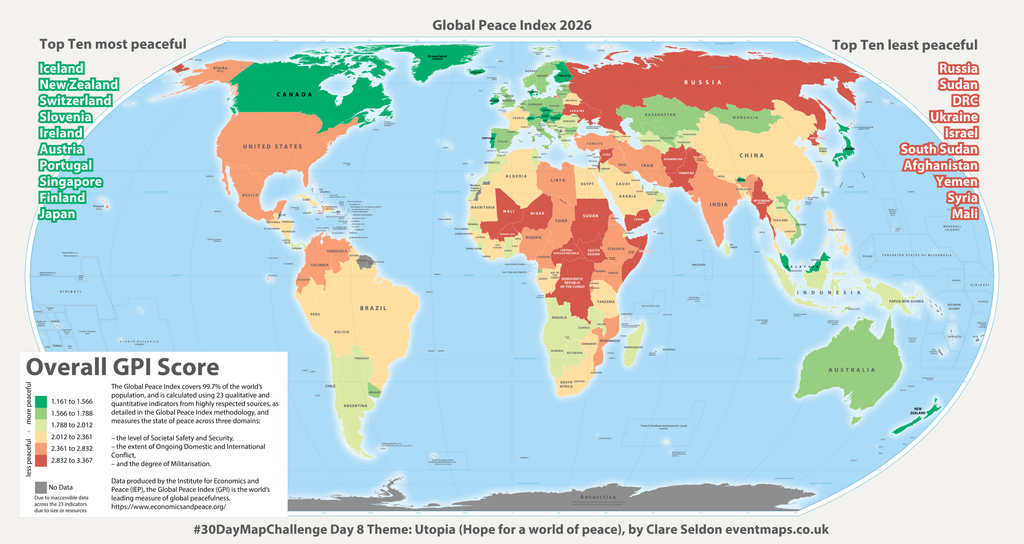
The Global Peace Index data on the map below shows the most and least peaceful nations in 2026, measured over 23 different factors. My hope is that in future years it may turn more and more green. Further details can be found at the Institute for Economics & Peace
I’ve made the image zoomable below (just click on it) so it’s easier to view.
Thanks go to:
🎥 BBC News report
😇 James Tan Song En, whom I just started following because of their maps this week, and to their inspirational map today based on “The New Jerusalem” description from the Bible.
🌍 equal-earth.com for the amazing Illustrator base map, using the new UN-approved Equal Earth world projection, which I overlaid Natural Earth data onto and joined the data table using the country code column.
🏳️🌈 Colorbrewer Company for a beautiful diverging set of colour swatches.
Day 9. Urban-Rural
Throughout my career, I have undertaken extensive transport and urban realm mapping, but have had relatively little experience of mapping rural or remote areas.
When considering the differences between these two environments through satellite and aerial imagery, I was reminded of the MapSwipe App, which the Humanitarian OpenStreetMap Team (HOT OSM) introduced us to during the recent #GeoBusiness Virtual event.
To make the most of today’s map challenge, I share here five minutes of me identifying squares with and without buildings to contribute to this initiative. It was a great opportunity to demonstrate the impact of humanitarian mapping efforts in India.
The interface is simple and intuitive: a single click for YES (a building is present), a double-click for MAYBE, and so on. These contributions help streamline the subsequent, more detailed digitisation of buildings by quickly identifying and eliminating areas where no buildings exist.
Getting involved is easy. You can access the app on either your mobile or PC and simply log in using your OpenStreetMap (OSM) account.
Give it a go at https://web.mapswipe.org
Day 10. Prompting only
As a geographer and a mum, I’ve supported other local mums over the last few years to create a secondary school catchment map.
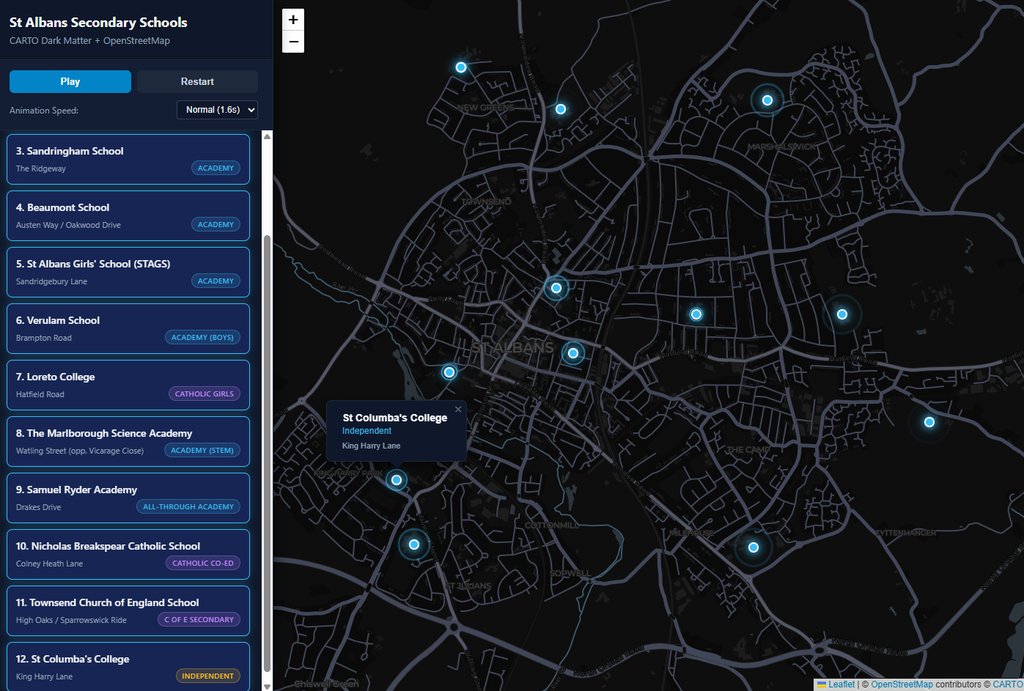
I thought a simple map showing the locations of the schools would test me enough to give this a try. I used Ask Chat AI (Gemini 3.8 Flash) alongside a free CARTO non-commercial API key, solely for this challenge.
Prompt 1: Please create a map using OpenStreetMap data with a CARTO Dark base map for St Albans, UK, and highlight secondary schools. Use my API key to unlock the base map layer XXXXXXXXXXXXXX. Then animate it to turn on each location one at a time.
Unfortunately this map was quite inaccurate with the points mostly all seeming to appear too far south of the true locations, and some pretty far away on the wrong road. However I liked the interface.
Prompt 2: The locations are not correct – please update and match them to the school building locations
One of the locations was still not correct…
Prompt 3: Marlborough School should also be moved to Waling Street, opposite Vicarage Close
I wanted it to be a bit more zoomed in…
Prompt 4: This map is good. Please increase the opening zoom level by one stage when first opening.
I was pleased to see it automatically included the OSM and CARTO copyright information and the following features were nice:
- Animated staggered reveals with custom CSS radar/ripple marker pulses.
- Side-by-side directory: Cards light up and auto-scroll into view synchronously with the map.
- Full controls: Pause, resume, restart, and switch between slow, normal, and fast speeds.
- Click-to-jump: Clicking any school in the sidebar jumps directly to it on the map.
Click on the image below for the HTML map page. It works fine on a computer, and in landscape on a mobile device.
Leave a Reply
You must be logged in to post a comment.